Retail Profitability Analysis
Strategic Pricing Intervention & What-If Simulation
1. Executive Summary
A profitability analysis of approximately 10,000 retail transactions identified a critical financial issue within the Central region. The Texas market is operating at a sustained -$33,955 net loss despite strong sales volume.
Implementing a targeted 5% discount reduction on high-discount transactions in Texas recovers $9,051.80 in net profit, improving the segment's performance by 26% without affecting overall operations.
2. Root Cause: Pricing Threshold
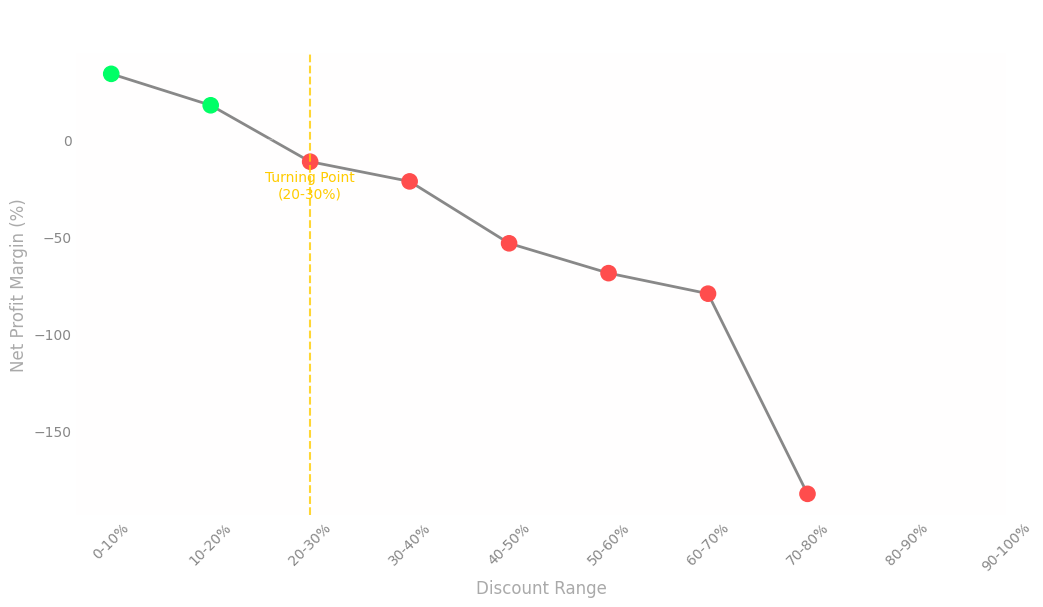
Initial analysis shows that standard discount levels generate a healthy +26.69% profit margin. However, performance deteriorates as discounts increase.
Profitability turns negative when discounts exceed the 20–30% range, revealing a structural pricing threshold.
This threshold explains why Texas operates at a loss, as discount levels in this region frequently fall within this range.
3. Targeted Simulation (What-If Analysis)
Instead of applying a general pricing adjustment, a targeted simulation was developed to isolate the effect of discount reductions on high-risk transactions. This approach isolates causality rather than relying on broad assumptions.
The model selectively reduces discounts by 5% only for transactions above the identified threshold, allowing for controlled evaluation of pricing adjustments.
Simulation Impact
Projected outcomes of the 5% discount reduction strategy.
Current State
Simulated State
Recovered Profit
Improvement
4. Interactive Dashboard
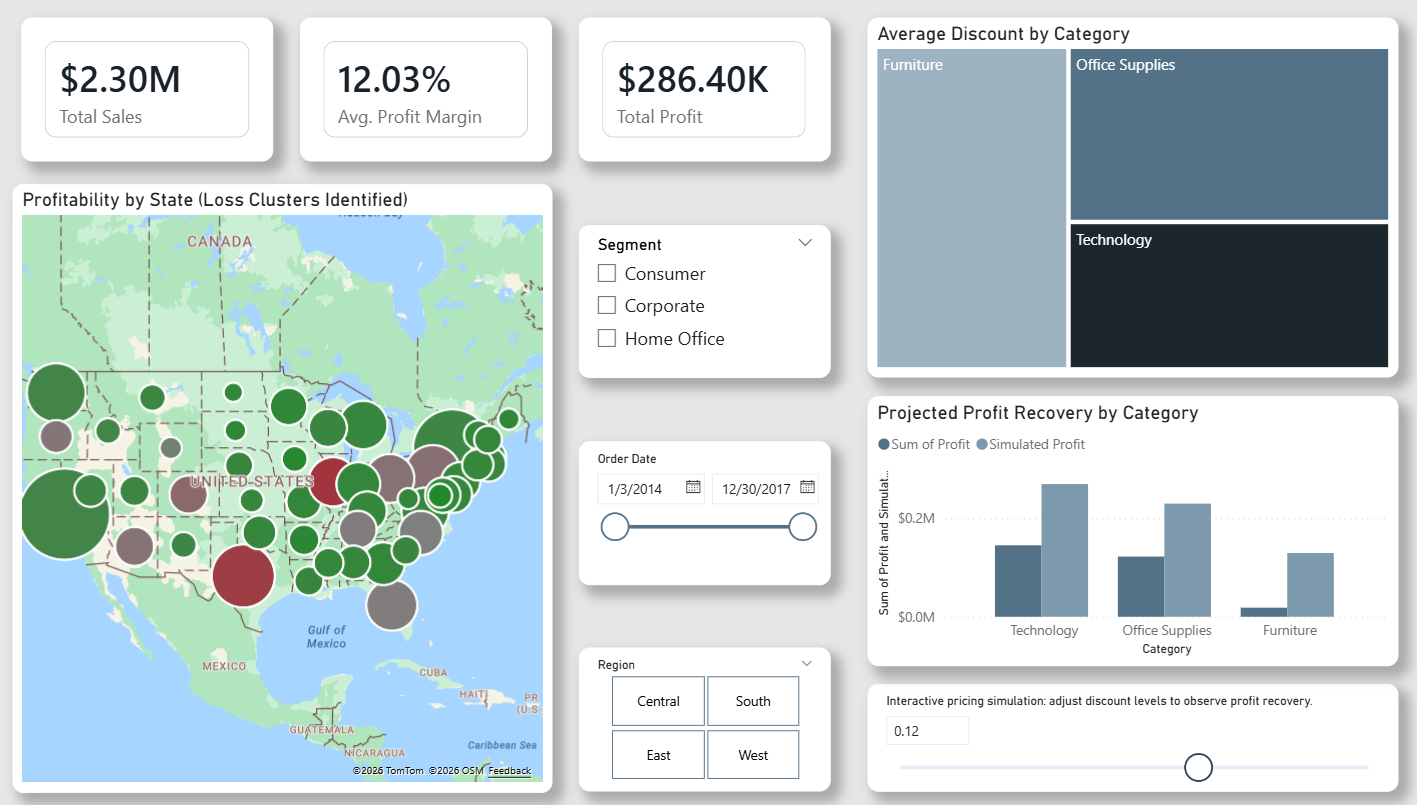
The analysis was translated into an interactive Power BI dashboard that operationalizes the identified pricing threshold.
A discount reduction parameter allows users to dynamically simulate pricing strategies and observe their impact on profitability across product categories. The results highlight that Furniture and Office Supplies present the highest recovery potential.
5. Technical Approach
- Data Processing: Cleaned and structured transactional data using Pandas.
- Feature Engineering: Created profitability and discount classification metrics.
- Statistical Binning: Applied
pd.cutto identify profitability thresholds. - Simulation Model: Built a pricing model to reconstruct original prices and simulate alternative discount strategies.
- BI Implementation: Developed dynamic measures in Power BI using DAX to support real-time scenario analysis.
Deep Dive into the Analysis
Download the full Evidence-Driven Case Study to review the complete methodology, Python diagnostic logic, and strategic recommendations.